I’m trying to learn proper logs, monitoring, otel, and grafana. Today I imported a bunch of pre-made k8s dashboards and made a few of my own for specific apps, and it made me want to know how I can turn my own custom dashboards into infrastructure as code. Turns out grafana makes it pretty easy to do this, if you have the grafana dashboard sidecar running. It will pick up any ConfigMap with the grafana_dashboard label and import it.
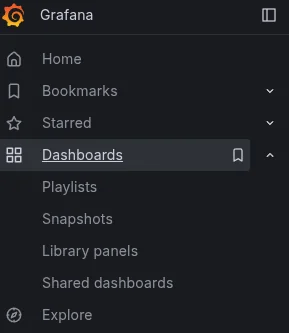
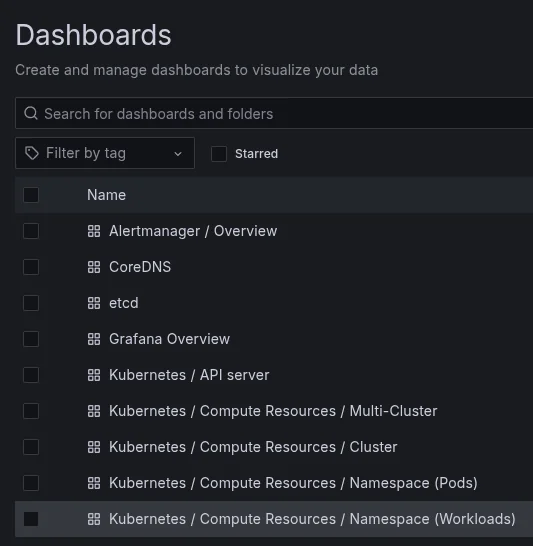
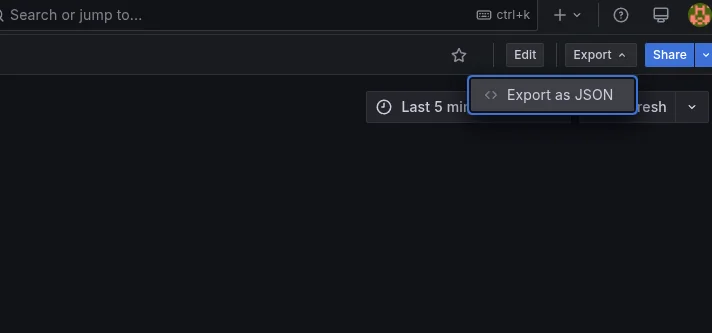
Go to Dashboards -> Pick a Dashboard -> Export -> JSON.
apiVersion: v1
kind: ConfigMap
metadata:
  name: my-dashboard
  namespace: meta
  labels:
    grafana_dashboard: "1"
data:
  my-dashboard.json: |
    {
      "annotations": {
        "list": [
      ...
      "uid": "fel2uhjhepg5ce",
      "version": 3
    }